Here is something I have been using lately as another interesting way to look at packet captures. It started with reports of intermittent connection drops. In this case we have a central Citrix farm used by hundreds of people from many different office locations across a fairly large geographic region (hundreds of miles). I thought it would interesting to look at net errors by location. For example grouping packets with the tcp reset flag by region over time. The idea being that a surge in resets at a location would indicate a site specific problem. I have also used this with firewall data to look at DoS attacks by region.
In a nutshell we need to get the starting and ending IP (as an integer) address range for each location. We will use PowerQuery (PQ) and the MaxMind data in a CSV file for this. Similarly we will take a netmon capture, export to CSV and get the Src or Dst IP represented as an integer. This too is done with Power Query. Once these two steps are done you have the data needed in Excel PowerPivot and can easily add a calculated column for the location.
Lets get started.
First lets get the MaxMind data into PowerPivot (PP). The MaxMind file (GeoLite2-Country-Blocks-IPv4.csv) looks like this:
network,geoname_id,registered_country_geoname_id,represented_country_geoname_id,is_anonymous_proxy,is_satellite_provider
1.0.0.0/24,2077456,2077456,,0,0
We need to take 1.0.0.0/24 and convert that to a start and ending IP. I do that with these steps in PQ:
- split the IP from the CIDR
- split the IP into its 4 octects
- IP as an integer is = ( (1stOct * 16777216) + (2ndOct * 65536) + (3rdOct * 256) + 4thOct ) this is the StartIPAsInt
- EndIPAsInt is = StartIPAsInt + 2 to the power of (32 – CIDR)
My PQ steps look like this (I call this query IPV4ToRegions):
let
Source = Csv.Document(File.Contents(“C:\Users\wes\Documents\NetSleuth\GeoIP\MaxMind\GeoLite2-Country-Blocks-IPv4.csv”),null,”,”,null,1252),
#”First Row as Header” = Table.PromoteHeaders(Source),
#”Changed Type” = Table.TransformColumnTypes(#”First Row as Header”,{{“network”, type text}, {“geoname_id”, Int64.Type}, {“registered_country_geoname_id”, Int64.Type}, {“represented_country_geoname_id”, type text}, {“is_anonymous_proxy”, Int64.Type}, {“is_satellite_provider”, Int64.Type}}),
#”Split Column by Delimiter” = Table.SplitColumn(#”Changed Type”,”network”,Splitter.SplitTextByDelimiter(“/”),{“network.1”, “network.2”}),
#”Changed Type1″ = Table.TransformColumnTypes(#”Split Column by Delimiter”,{{“network.1”, type text}, {“network.2”, Int64.Type}}),
#”Renamed Columns” = Table.RenameColumns(#”Changed Type1″,{{“network.1”, “network”}, {“network.2”, “cidr”}}),
#”Duplicated Column” = Table.DuplicateColumn(#”Renamed Columns”, “network”, “Copy of network”),
#”Renamed Columns1″ = Table.RenameColumns(#”Duplicated Column”,{{“Copy of network”, “net”}}),
#”Split Column by Delimiter1″ = Table.SplitColumn(#”Renamed Columns1″,”net”,Splitter.SplitTextByDelimiter(“.”),{“net.1”, “net.2”, “net.3”, “net.4”}),
#”Changed Type2″ = Table.TransformColumnTypes(#”Split Column by Delimiter1″,{{“net.1”, Int64.Type}, {“net.2”, Int64.Type}, {“net.3”, Int64.Type}, {“net.4”, Int64.Type}}),
#”Added Custom” = Table.AddColumn(#”Changed Type2″, “StartIPAsInt”, each ([net.1]*16777216)+([net.2]*65536)+([net.3]*256)+[net.4] +1),
#”Changed Type3″ = Table.TransformColumnTypes(#”Added Custom”,{{“StartIPAsInt”, Int64.Type}}),
#”Added Custom1″ = Table.AddColumn(#”Changed Type3″, “EndIPAsInt”, each [StartIPAsInt]+Number.Power(2,(32-[cidr])) -2),
#”Changed Type4″ = Table.TransformColumnTypes(#”Added Custom1″,{{“EndIPAsInt”, Int64.Type}})
in
#”Changed Type4″
It’s important that the start and end IP are of whole number type.
The next step is to get your capture in a good CSV format. Lately I have been using the Wireshark GUI to do this, it’s fast. I create this profile in Wireshark so I get the columns I want in the CSV.
Displayd Title: Field Type
Time: UTC time
DateTimePST: Absolute date, as YYYY-MM DD, and time
RelativeTime: Relative time
Source: Src addr (unresolved)
Destination: Dest addr (unresolved)
Protocol: Protocol
Length: Packet length (bytes)
SrcPort: Src port (unresolved)
DstPort: Dest port (unresolved)
TcpSYN: Custom (tcp.flagssyn)
TcpRST: Custom (tcp.flags.reset)
TcpACK:Custom (tcp.flags.ack)
Again bring this in to Excel using PQ, do the splits and math to get the IPs as integers with type whole number. My PQ code to do this was(I called this query parseWiresharkExport, I just did the DstIP in this example):
let
Source = Csv.Document(File.Contents(“C:\Users\wes\Documents\NetSleuth\GeoIP\BlogbridgeCapture_CSV.csv”),null,”,”,null,1252),
#”First Row as Header” = Table.PromoteHeaders(Source),
#”Changed Type” = Table.TransformColumnTypes(#”First Row as Header”,{{“DateTimePST”, type datetime}}),
#”Duplicated Column” = Table.DuplicateColumn(#”Changed Type”, “DateTimePST”, “Copy of Time”),
#”Duplicated Column1″ = Table.DuplicateColumn(#”Duplicated Column”, “DateTimePST”, “Copy of Time.1”),
#”Renamed Columns” = Table.RenameColumns(#”Duplicated Column1″,{{“Copy of Time”, “Minute”}, {“Copy of Time.1”, “Second”}}),
#”To Minute” = Table.TransformColumns(#”Renamed Columns”,{{“Minute”, Time.Minute}}),
#”To Second” = Table.TransformColumns(#”To Minute”,{{“Second”, Time.Second}}),
Rounding = Table.TransformColumns(#”To Second”,{{“Second”, each Number.Round(_, 0)}}),
#”Duplicated Column2″ = Table.DuplicateColumn(Rounding, “Destination”, “Copy of Destination”),
#”Renamed Columns1″ = Table.RenameColumns(#”Duplicated Column2″,{{“Copy of Destination”, “DstIP”}}),
#”Filtered Rows” = Table.SelectRows(#”Renamed Columns1″, each ([Protocol] = “HTTP” or [Protocol] = “TCP” or [Protocol] = “TLSv1.2”)),
#”Split Column by Delimiter” = Table.SplitColumn(#”Filtered Rows”,”DstIP”,Splitter.SplitTextByDelimiter(“.”),{“DstIP.1”, “DstIP.2”, “DstIP.3”, “DstIP.4”}),
#”Changed Type1″ = Table.TransformColumnTypes(#”Split Column by Delimiter”,{{“DstIP.1”, Int64.Type}, {“DstIP.2”, Int64.Type}, {“DstIP.3”, Int64.Type}, {“DstIP.4”, Int64.Type}}),
#”Added Custom” = Table.AddColumn(#”Changed Type1″, “DstIPAsInt”, each ([DstIP.1]*16777216) + ([DstIP.2]* 65536) + ([DstIP.3]*256) + [DstIP.4]),
#”Changed Type2″ = Table.TransformColumnTypes(#”Added Custom”,{{“DstIPAsInt”, Int64.Type}}),
#”Duplicated Column4″ = Table.DuplicateColumn(#”Changed Type2″, “DateTimePST”, “Copy of Time”),
#”Renamed Columns2″ = Table.RenameColumns(#”Duplicated Column4″,{{“Copy of Time”, “Hour”}}),
#”To Hour” = Table.TransformColumns(#”Renamed Columns2″,{{“Hour”, Time.Hour}}),
#”Reordered Columns” = Table.ReorderColumns(#”To Hour”,{“Time”, “DateTimePST”, “RelativeTime”, “Source”, “Destination”, “Protocol”, “Length”, “SrcPort”, “DstPort”, “TcpSYN”, “TcpRST”, “TcpACK”, “Hour”, “Minute”, “Second”, “DstIP.1”, “DstIP.2”, “DstIP.3”, “DstIP.4”, “DstIPAsInt”})
in
#”Reordered Columns”
Be sure to load your PQ to the Data Model.
I also brought into Excel the MaxMind GeoLite2-Country-Locations-en file and created a relationship so the region name is displayed in English.
Now we are ready to add a calculated column in PowerPivot to parseWiresharkExport table. The formula is:
=CALCULATE(
VALUES(RegionName_English[country_name]),
FILTER(
IPv4ToRegions,
parseWiresharkExport[DstIPAsInt] >= IPv4ToRegions[StartIPAsInt] && parseWiresharkExport[DstIPAsInt] <= IPv4ToRegions[EndIPAsInt]
)
)
And that’s pretty much it. Now I have a PivotTable like this showing a count of DstIPs from each location. You can easily imagine taking the time from the capture, converting that to day, hour, min, sec and adding this to the X axis of a PivotChart with a sum of tcp resets by location. I usually end up making a few PivotCharts looking at the data in different ways. I often create slicers for the IP octects and this make it easy to filter down the view.
Location Count of Location
United States 1851
Switzerland 20
Canada 18
Netherlands 11
United Kingdom 6
Germany 5
Singapore 2
Grand Total 1913
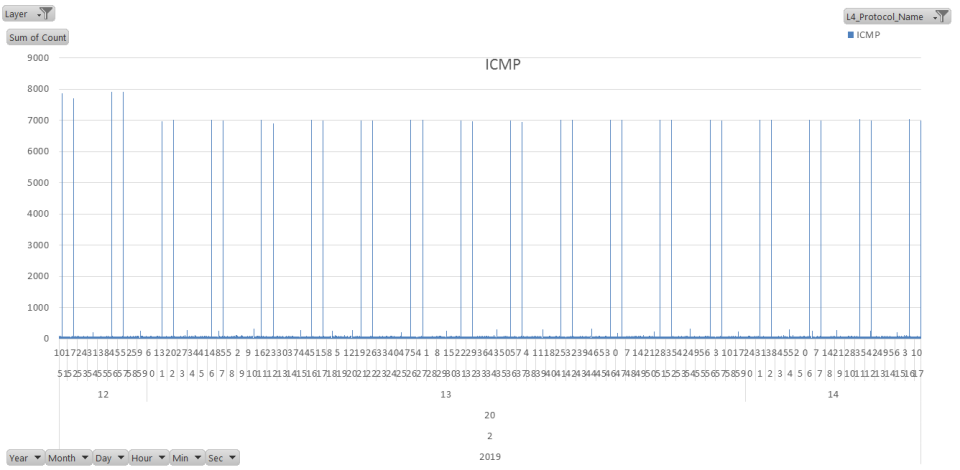
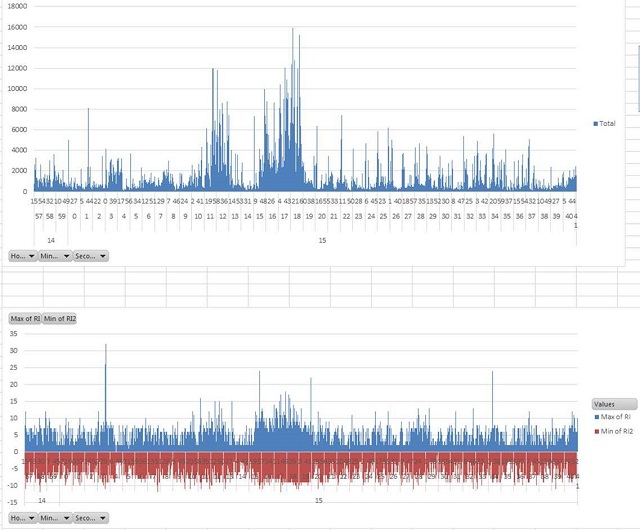
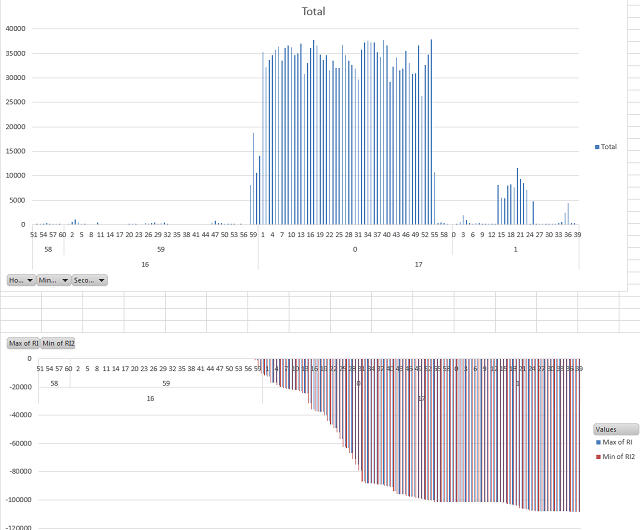
Some screen shots in case you got lost along the way. Or maybe not, I can’t seem to get the Blog editor to upload images.